


Respiratory Disease Surveillance, Seasonality, and Sars-CoV-2
Respiratory Disease Surveillance, Seasonality, and Sars-CoV-2
When did the pandemic end in Canada and Germany?
Among German lockdown sceptics, official data from the infectious disease agency RKI made the rounds, which suggest that Sars-CoV-2 may have disappeared as early as mid-April 2020. We will take a look at the last weekly report of the RKI's routine influenza surveillance workgroup for the 2019/20 season ending September 29th, available via https://influenza.rki.de/Wochenberichte.aspx. The surveillance program is conducted through five avenues: a voluntary population survey, an incidence index based on consultations for acute respiratory diseases at some 750 regional doctors' practices, lab reports from a sentinel network of some 35 representative doctors, lab-confirmed flu cases reported in adherence to the infectious disease act, and data from 69 sentinel hospitals about patients with severe acute respiratory illness.
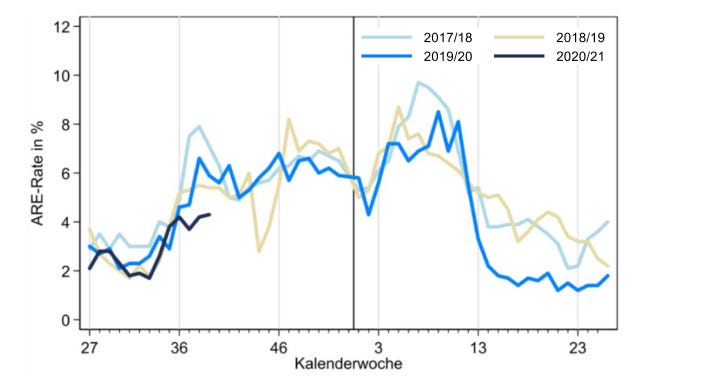
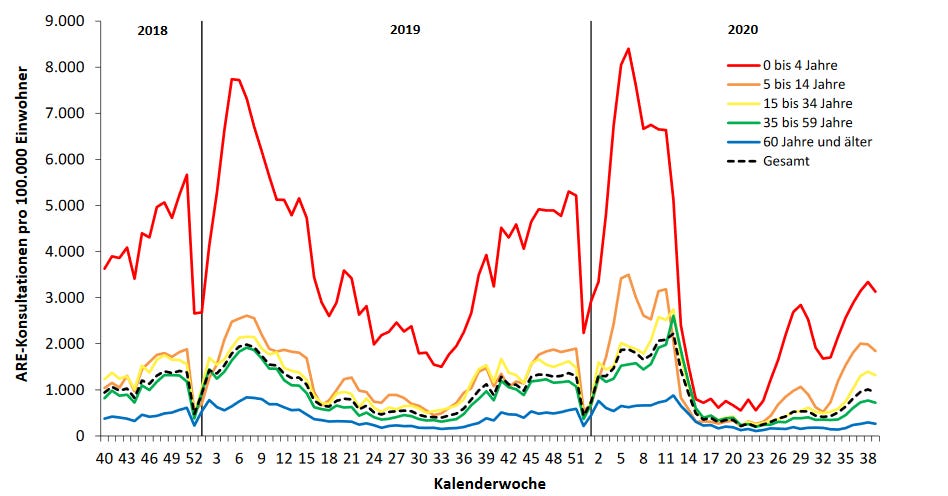
The survey data are extrapolated to the population of Germany and move within a weekly range of about 1% to 10% of people having a flu-like illness. The 2019/20 curve (blue line in Fig. 1a) peaked in weeks 9 and 11, around February 26 and March 11, 2020, at a level comparable to the two previous years, and dropped very quickly to a level markedly lower than the previous years. The third quarter of 2020 (black line) had a very similar trajectory to all three previous years. A similar seasonal pattern can be observed from the doctors' consultation index shown by age group, with young children aged 0-4 years (red line in Fig. 1b) being over-represented and people 60 and over being under-represented. Note that these data are presented as rates out of 100,000 in the same age group, with the dotted black curve being the rate in the entire population. Overall, these data illustrate that 2019/20 was not a particularly severe year for respiratory diseases in Germany. Note that pandemic response measures started in week 11 and a lockdown --- light by international comparison --- was implemented in week 13, coincident with a burden of respiratory disease that had already plummeted.
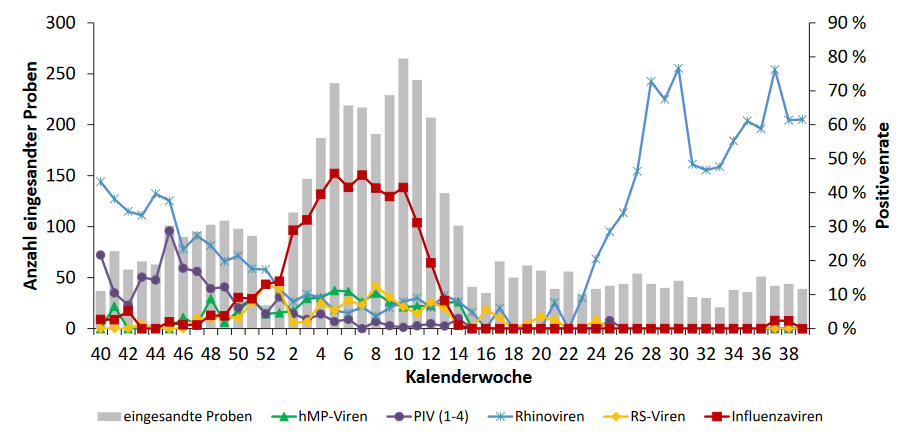
The sentinel data show the number of samples received (Fig. 2a, left axis and grey bars) and the test positivity rates for five groups of respiratory viruses (right axis and coloured curves). Influenza viruses dominated the winter months with up to about 50% positivity, yet interestingly Rhinoviruses took over in the summer months with rates up to 80% positive. Interestingly, the Rhinovirus wave started about 4-5 weeks after orders to wear masks or face covering in public-access indoor settings were put in place. In contrast, Sars-CoV-2 is too insignificant in the sentinel program to be visible on the graph, and the endemic coronaviruses causing the common cold were not considered important enough to be included either.
Table 2 of the RKI report includes data for the entire 2019/20 flu season between week 40 (October) of 2019 and week 39 (September) of 2020. A total of 4,625 sentinel samples were submitted, of which 2,283 contained a respiratory virus. Influenza A or B were detected in 918 samples while Rhinoviruses were found in 827 samples. Since week 8 of 2020, the samples were also analyzed for Sars-CoV-2, yet only 14 of all 4,625 samples (0.3%) had the novel coronavirus. Of those, 13 were from weeks 11 to 15 (March 9 to April 12), with not a single Sars-CoV-2 detection since then until week 39 (September). This is why lockdown critics in Germany declared the pandemic over in mid-April. Media fact checkers disputed this conclusion with reference to the low numbers of submitted samples. Given that the flu surveillance programs are the authoritative approach to monitoring the public health threat from the annual flu cycle, discrediting its accuracy when the results do not fit the narrative of the COVID-19 pandemic appears to be rather disingenuous.
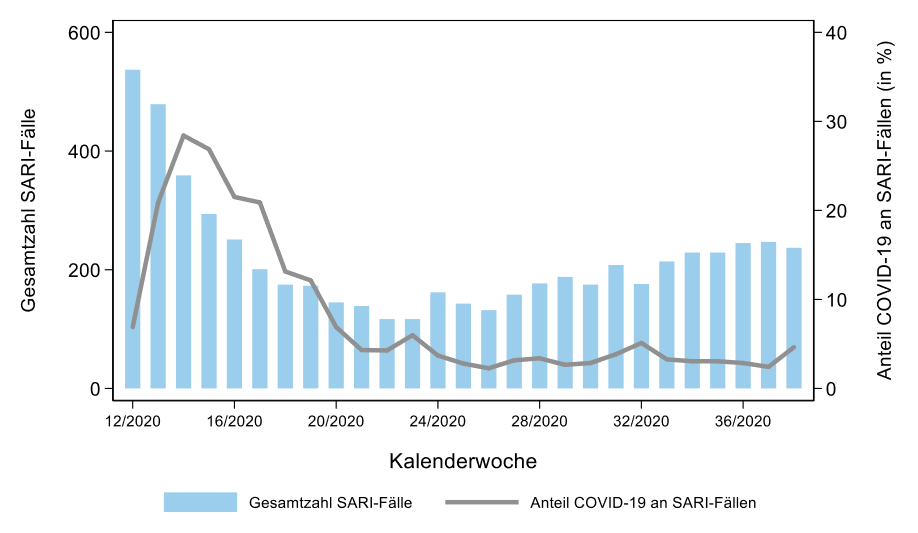
However, a look at a final graph from the RKI report (Fig. 2b) tells us that Sars-CoV-2 did not entirely disappear, as it was still present in patients hospitalized with severe acute respiratory disease throughout the 2020 spring and summer. The total number of hospitalizations in the 69 reporting hospitals declined from over 500 in March to around 100 in May/June and rose again to some 200 in September. However, COVID-19 diagnoses plummeted from near 30% to below 5% and remained there until the end of the 2019/20 reporting year. Therefore, Sars-CoV-2 did not entirely disappear (and it has in fact come back in hospital reports for October 2020), yet the proportion of COVID-19 --- you know, the actual illness! --- among respiratory disease patients in ambulatory or hospital care in Germany never looked significant or worthy of a pandemic based on these data!
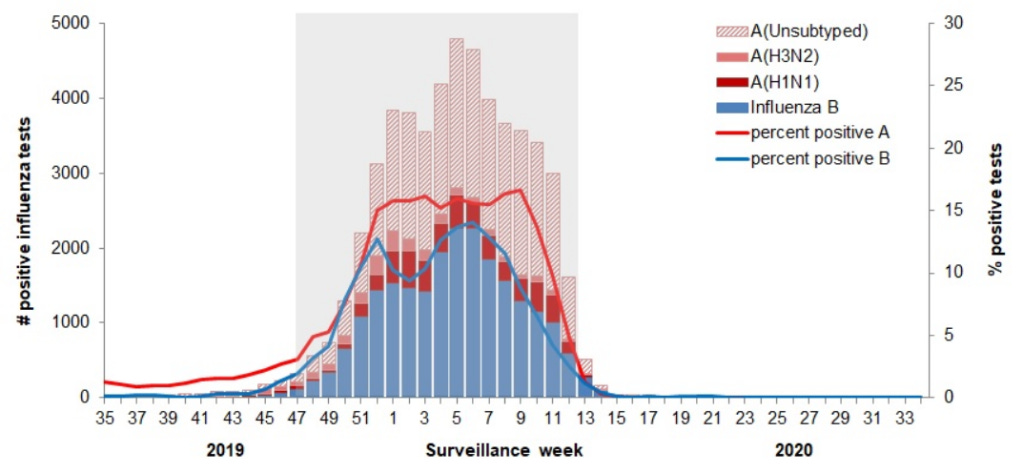
Moving across the big pond, Canada's respiratory disease surveillance program is called FluWatch. Like the German program, FluWatch has a number of reporting avenues that I do not want to detail here, please see https://www.canada.ca/en/public-health/services/diseases/flu-influenza/influenza-surveillance.html instead. We will look at two graphs from two final reports by the Public Health Agency of Canada (PHAC) on flu and other respiratory diseases, respectively, for the 2019/20 cycle. The graphs illustrate the seasonal patterns of influenza types (Fig. 3a) and other respiratory viruses being monitored (Fig. 3b) for the 2019/20 cycle. Note that the test positivity rate is included with the flu reporting, as would have been appropriate to do from early 2020 for COVID-19 PCR test results too.
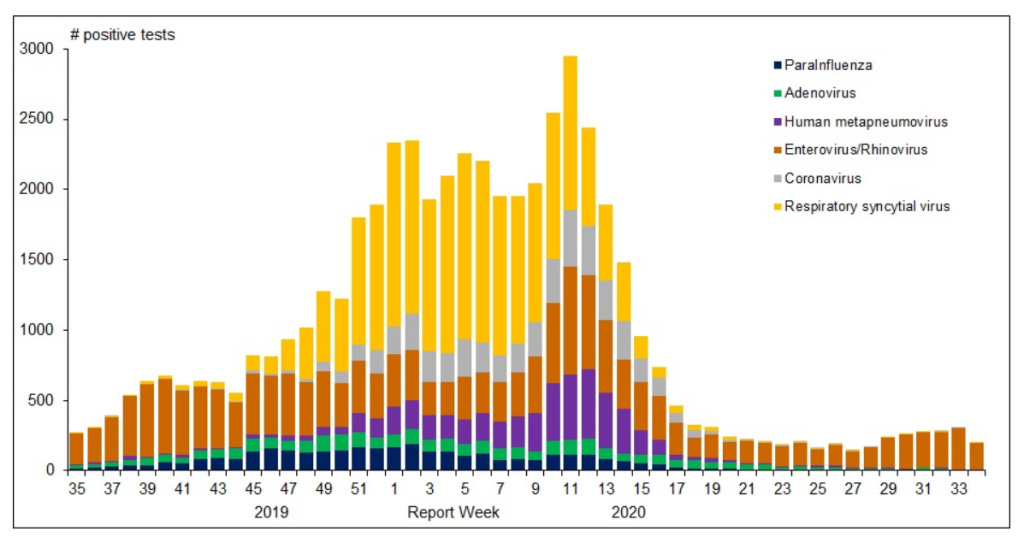
The second graph includes "coronavirus" in grey, with a mid- to late-season distribution with up to around 15% of all non-influenza viruses found, or some 5% to 7% maximum if flu is included. The corona curve declines along with several other viruses and visually disappears around week 20. In the same PHAC report, the data table associated with the graph confirms that coronavirus detections are in the single digits from week 23 to the end of the cycle (week 34). Importantly however, the report includes a disclaimer that coronavirus here refers to the "normal", seasonally recurring human coronaviruses, not to Sars-CoV-2. Therefore, we cannot deduct that the COVID-19 pandemic has ended in Canada, at least not from these data. Instead, we should ask the question, why PHAC did not add Sars-CoV-2 to the set of viruses monitored under the FluWatch program, since this would ensure comparable laboratory testing and allow for important comparisons with our well-known respiratory viruses.
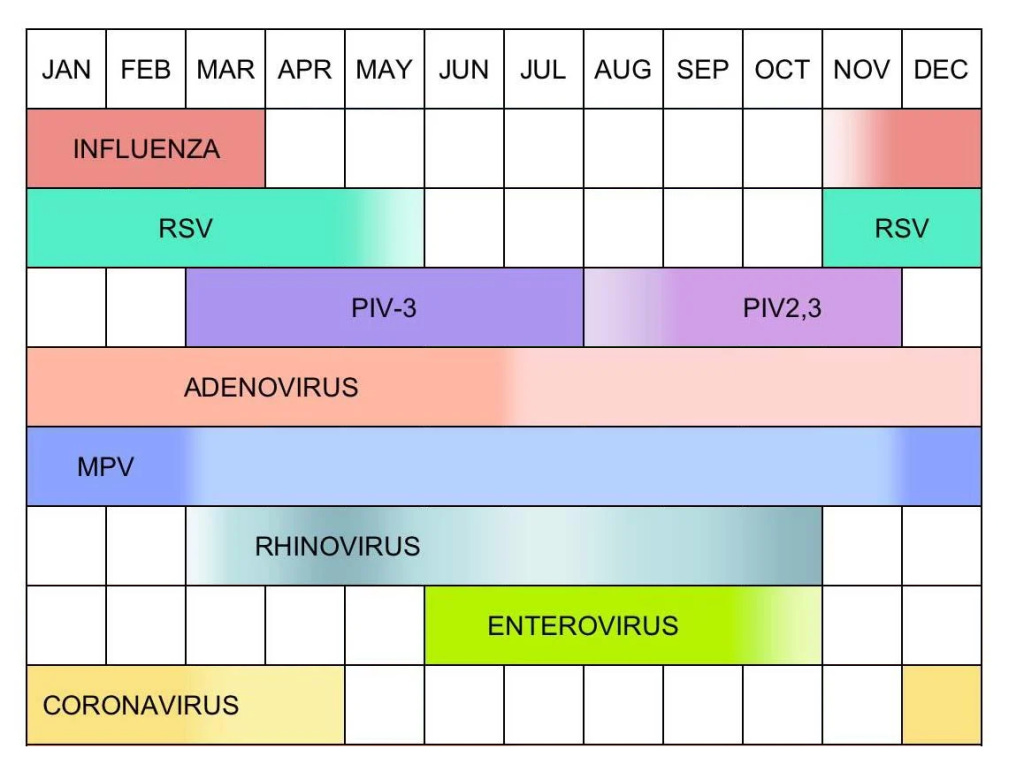
The chart in Fig. 4 (adapted from Meneghetti 2020) illustrates the seasonal fluctuations (presumably for the northern hemisphere) of the respiratory viruses that we humans have adapted to live with. It is reminiscent of a pollen calendar, though note that in contrast to pollen exposure we are subject to viruses year-round without respite! The chart reiterates the message that waves of respiratory disease pathogens come and go in an annual cycle, as seen in the Canadian (Fig. 3b) and German (Fig. 2a) flu surveillance programs.
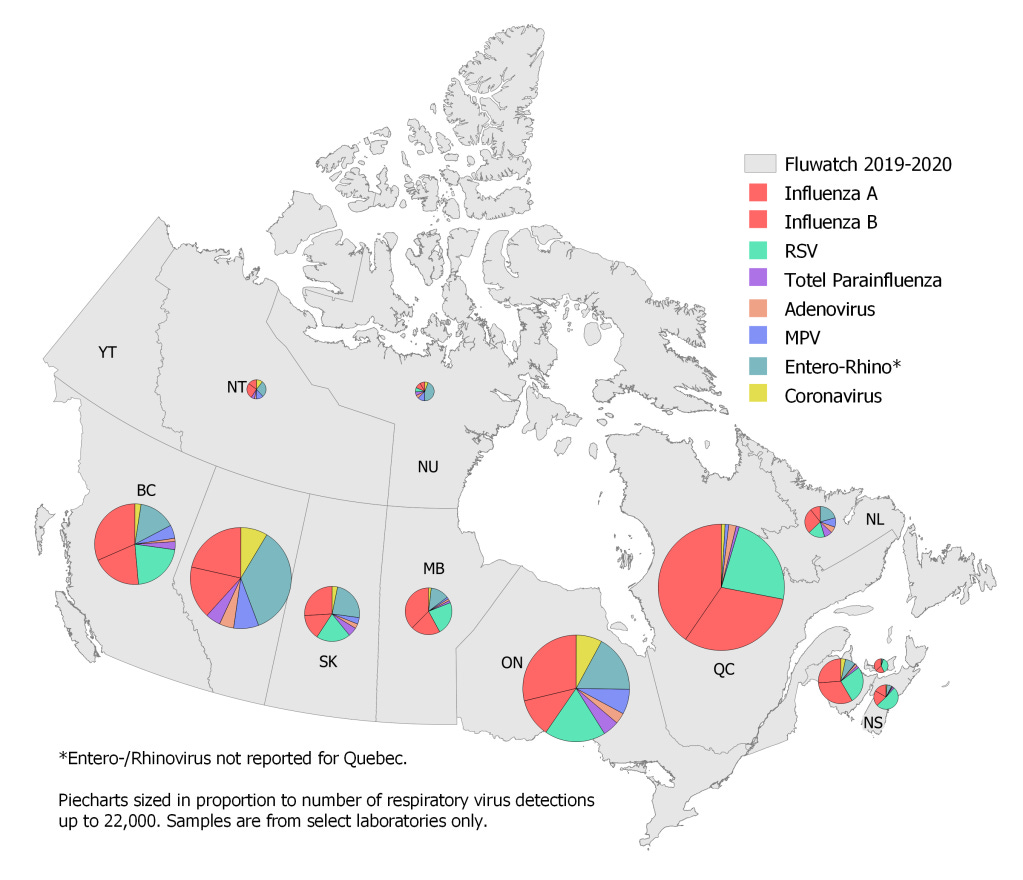
The following map is based on the data presented in Table 2 of the Canadian "Respiratory Virus Report, week 34 - ending August 22, 2020" via https://www.canada.ca/en/public-health/services/surveillance/respiratory-virus-detections-canada.html. I attempted to replicate the colours used for each virus family in Fig. 4. Across Canada's provinces, there is relative consistency in terms of the proportions of different lab-confirmed pathogens, with Influenza A and B making up between one third to over half of detections, and respiratory syncytial virus (RSV) and Entero- and Rhinoviruses contributing another one-fifth each. Note that Quebec does not seem to report the Entero/Rhino category, thereby skewing the proportion of the remaining viruses, and Alberta reported zero RSV for the year, leaving more "room" for other viruses, in particular Entero/Rhino. The pie charts are sized in proportion to the number of samples with at least one virus detected, a number ranging up to over 20,000 for Quebec. I am not providing the specific counts, since the surveillance program is based on a selection of laboratories and the data were not extrapolated to represent the entire Canadian population.
So, when did the Sars-CoV-2 pandemic end in Canada and Germany? I am not sure that the national respiratory disease surveillance programs we looked at can answer this question. However, they help answer an even more fundamental question: Is there a Sars-CoV-2 pandemic at all? I am not a medical scientist or practitioner, nor an epidemiologist or immunologist or virologist or public health expert. But I do understand data and have a healthy dose of common sense. The relative magnitude of Sars-CoV-2 and COVID-19 in these and other datasets such as national and global mortality statistics do not support the view that 2020 is qualitatively different from the last two or three decades in terms of our respiratory disease burden. Instead, we seem to have forgotten that life and also death with viruses is part of our existence on planet earth. We need to redirect our fear-stricken gaze away from COVID-19 and tackle the complexities of the corona crisis and all the other challenges our society is facing using science, collaboration, and above all common sense.